Understanding Local Market Reach in Mobile Advertising
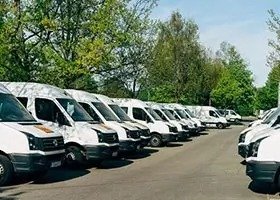
Local market reach refers to how effectively your brand is seen and recognized within a defined geographic area. Unlike static ads, fleet wraps operate as mobile billboards, delivering impressions across multiple high-traffic zones—residential streets, commercial districts, and commuting routes.
The challenge is that fleet wraps don’t produce direct click-through data like digital campaigns. Instead, their effectiveness must be assessed through a combination of estimated impressions, behavioral signals, and business outcomes.
Key Metrics to Track Fleet Wrap Performance
1. Impressions and Daily Exposure
The most widely used metric for fleet wraps is impressions—the number of times your vehicle is seen by pedestrians and drivers. This is typically calculated using:
- Average daily mileage of each vehicle
- Traffic density in operating areas
- Visibility factors such as vehicle size and route type
Industry estimates suggest that a single wrapped vehicle can generate 30,000 to 70,000 impressions per day in urban or suburban environments. Over time, this compounds into millions of annual impressions from a single asset.
2. Geographic Coverage and Route Density
To measure local reach, analyze where your vehicles travel most frequently. Are they concentrated in high-value neighborhoods or business districts?
Using GPS tracking or route logs, businesses can:
- Map coverage zones
- Identify underrepresented areas
- Align routes with target customer demographics
This transforms fleet wraps from passive branding into a strategically deployed marketing tool.
3. Brand Recall and Recognition
One of the strongest indicators of fleet wrap effectiveness is brand recall. While harder to quantify, it can be measured through:
- Customer surveys (“How did you hear about us?”)
- Community feedback
- Increased recognition during sales interactions
Consistent exposure builds familiarity, and familiarity drives trust—especially in local service industries.
4. Lead Attribution and Inquiry Volume
Fleet wraps often drive indirect conversions. To track this:
- Use unique phone numbers or landing pages on the wrap
- Monitor spikes in inbound calls or website visits after deployment
- Compare lead volume before and after wrapping vehicles
Even without direct attribution, noticeable increases in inquiries often correlate with increased visual exposure.
5. Cost Per Impression (CPI)
Compared to other advertising channels, fleet wraps excel in cost efficiency.
For example:
- A $3,000 wrap lasting 3–5 years
- Generating ~50,000 daily impressions
This results in an extremely low cost per impression—often outperforming digital and outdoor advertising channels over time.
Methods for Evaluating Real-World Impact
Before-and-After Analysis
One of the simplest ways to measure effectiveness is comparing business performance metrics before and after implementing fleet wraps:
- Website traffic
- Call volume
- Local search visibility
- Sales inquiries
While not perfectly isolated, consistent upward trends provide strong indicators of impact.
Controlled Rollout Strategy
If you operate multiple vehicles, consider wrapping a subset first. This allows you to:
- Compare performance between wrapped and unwrapped vehicles
- Identify measurable differences in lead generation
- Optimize design and messaging before scaling
Customer Feedback Loops
Don’t underestimate direct customer input. Asking a simple question—“Where did you hear about us?”—can reveal valuable insights. Many businesses discover that fleet visibility plays a larger role than expected.
Factors That Influence Measurable Success
Not all fleet wraps deliver equal results. Several variables significantly affect performance:
Design Quality
Clear messaging, bold typography, and high-contrast visuals increase readability at a distance. Overly complex designs reduce effectiveness.
Call-to-Action Placement
Phone numbers, URLs, or QR codes should be highly visible and easy to remember. Poor placement can limit conversion opportunities.
Vehicle Type and Size
Larger vehicles naturally generate more impressions. Box trucks and vans typically outperform smaller cars in visibility.
Route Strategy
Vehicles operating in dense commercial zones generate more impressions than those in low-traffic areas.
The Long-Term Value of Fleet Wrap Advertising
Unlike digital ads that stop delivering once budgets run out, fleet wraps continue to generate impressions daily. This makes them particularly valuable for:
- Local service providers
- Contractors and home service businesses
- Delivery and logistics companies
Over time, repeated exposure builds brand familiarity, which shortens sales cycles and increases conversion rates.
Integrating Fleet Wraps into a Broader Marketing Strategy
Fleet wraps are most effective when combined with other marketing channels. For example:
- Reinforcing brand recognition from online ads
- Supporting local SEO by increasing branded searches
- Enhancing credibility when customers see your vehicles in their neighborhood
This multi-channel reinforcement amplifies overall marketing performance.
Conclusion
Measuring the impact of commercial fleet wraps on local market reach requires a shift from purely digital metrics to a broader, more integrated evaluation approach. By analyzing impressions, geographic coverage, lead trends, and customer feedback, businesses can gain a clear understanding of how mobile branding contributes to growth.
When executed strategically, fleet wraps are not just a branding tool—they are a scalable, cost-efficient advertising asset that delivers continuous visibility in your target market.
For businesses looking to improve local reach and brand recognition, partnering with an experienced provider like Super Custom Signs can ensure your fleet graphics are designed and deployed for maximum measurable impact.